
NOTE: This article has only an analysis and research aspect and the simulated indicators are based only on data and formulas. Make a decision in your own investment and be careful!
I. Introduction
In the ever-shifting realm of cryptographic currencies and the intricacies of decentralized finance (DeFi), Uniswap emerges as a formidable force orchestrating the ballet of trading, liquidity provision, and the intricate machinations that sustain the ecosystem’s very essence. One is compelled to ponder: how does Uniswap gracefully pirouette through the ebullient expanse of bullish market fervor and somberly waltz amidst the bearish undertones? In this labyrinthine exposition, we embark on a cerebral odyssey, dissecting the idiosyncrasies of Uniswap’s liquidity pools during epochs of exuberance and despondency, unearthing the Herculean challenges that stand as towering monoliths and the labyrinthine strategies that thread the needle through the capricious tapestry of market volatility.
II. Uniswap Pools
A. Unraveling Uniswap in the Bosom of Bullish Exuberance
In the kaleidoscopic tapestry of bullish epochs, where the cadence of rising prices orchestrates a symphony of optimistic market sentiment, Uniswap liquidity pools ascend as veritable pillars, staunchly buttressing the deluge of heightened trading fervor. A pulsating dance unfolds, as the market, bathed in the effulgence of positivity, witnesses Uniswap’s decentralized sanctuaries becoming the nexus of voracious trading pursuits. The demand for liquidity, akin to a ravenous tide, surges forth, and the decentralized fabric of Uniswap unfurls, providing an effervescent conduit to an expansive spectrum of trading pairs. A heterogeneous cohort of liquidity providers, lured by the siren call of incentives, gravitates toward these pools, their assets woven into the intricate lattice, weaving an elaborate tapestry of financial fecundity. Fees, akin to nectar, flow into the coffers of these contributors, fostering an environment where liquidity luxuriantly abounds. In this veritable oasis, traders navigate the labyrinth of transactions with an alacrity nurtured by abundant liquidity, orchestrating trades with a virtuosic finesse that begets an overall euphoric trading odyssey.
B. Unraveling Uniswap Amidst the Murky Embrace of Bearish Despondency
Contrarily, within the shadowy recesses of bearish epochs, where the symphony is replaced by the dissonant dirge of descending prices and a shroud of pessimism cloaks the market, Uniswap liquidity pools stand resolute, facing the crucible of unique tribulations. The undulating trajectory of prices, now in a protracted descent, engenders an atmosphere of trepidation, inducing traders and investors into a measured retreat, diminishing the once fervent cadence of trading activity. This attenuation in demand, akin to a dwindling current, manifests as a double-edged sword, as it casts its aspersions on the availability of liquidity within the Uniswap pools. The consequence—a labyrinth of spreads widens, and the specter of slippage lurks ominously.
Yet, in this chiaroscuro of financial uncertainty, the automated market-making machinery of Uniswap emerges as a luminescent beacon. Algorithmic acrobatics, perpetually recalibrating token valuations in response to the ebb and flow of supply and demand, serve as a guardian, ensuring assets persistently frolic within the realm of tradability. The permissionless ethos of Uniswap unfurls its wings, facilitating the continual infusion of novel trading pairs into the fold. A magnetic allure beckons liquidity providers, visionaries in search of opportunities amidst undervalued assets or tokens harboring latent potential, becoming architects of a liquidity resurgence in defiance of bearish shadows.
C. Percentage distribution of blockchains in lps created in Uniswap
Behold the intricate tapestry unfurling below, a visual sonnet portraying the esoteric dance of Liquidity Providers (LPs) within the Uniswap ecosystem across the vast expanse of blockchains over temporal epochs.
The chart unfolds as an ever-evolving manuscript, meticulously updated weekly, intricately capturing the rhythmic dance of LP creations. Ethereum emerges as the central protagonist in this statistical ballet, witnessing a crescendo of LPs birthing into existence, their genesis interwoven with the fabric of time. The audacious Polygan network asserts its presence, claiming a substantial portion of the LP landscape, yet Ethereum stands as an indomitable sovereign, towering over its blockchain counterparts.
The diagram transforms into a cosmic ballet of percentages, each network—whether a recent entrant or an established denizen—staking its claim in the coveted LP realm. Ethereum, resilient and regal, maintains its apical zenith, orchestrating an unparalleled symphony of LP ascendancy. In the grand narrative of LP proliferation, each network inscribes its numerical legacy onto the Uniswap palimpsest. Ethereum, an enduring protagonist, not only retains but ascends to the pinnacle, a testament to its unwavering allure amidst the perpetual ebb and flow of blockchain dynamics.
D. ETH price with number of LPs over time on Uniswap
Embark on a mystifying journey through Ethereum’s price evolution from January 2021 to July 2022, witnessing the fluctuating dance of liquidity pool creation, ranging from 160 to a staggering 1894 per week. A symphony of bullish enthusiasm echoes, inviting investors into a diverse array of opportunities. However, July 2022 introduces a clandestine metamorphosis, a paradoxical surge in Uniswap LP creation amidst a market in retreat. The zenith occurs in the week of 05-15-2023, where LPs reach an unprecedented ATH of 5392, defying market pessimism. A cryptic subplot unfolds with Bitcoin’s ascent mirroring Ethereum, orchestrating a subtle reduction in LPs, impacting the fabric of liquidity creation. December 2023’s pages hold the continuation of this esoteric narrative, challenging norms and perplexing market seekers.
III. Bitcoin buying/selling power in Uniswap and its dependence on Volume
In this review, we calculated the volume of sales and purchase volume of Bitcoin in Uniswap and calculated the power of buying and selling on a monthly basis with this method. In the month when the number is negative, it means that the selling power of Bitcoin is more than buying, and in the month when the number is positive, it means that the buying power of Bitcoin is more than selling. In the last few months, we have seen an increase in the purchasing power of Bitcoin on Uniswap. We have calculated the buying/selling power cumulatively (the line that can be seen in the graph) and we have seen an increase in the purchasing power of Bitcoin since the 6th month of 2023.
IV. The Balance of Power (BOP)
The Balance of Power (BOP) indicator uses price to measure buying and selling pressure. It determines the strength of the buyers and sellers by looking at how strongly the price has changed, rather than using volume. Zero-line crossovers of the BOP indicator can be used as a signal for trend reversals. BOP is sometimes referred to as Balance of Market Power (BMP).
Embark upon the intricate voyage of comprehending Livshin’s intricate methodology for the Balance of Power (BOP) indicator calculation. The original algorithm, a labyrinth of sophistication, unfolds into a more succinct formula:
BOP = (Close - Open) / (High - Low)
In this cryptic equation, the variables ( Close ), ( Open ), ( High ), and ( Low ) dance together, portraying the daily ebb and flow of a security. The raw oscillations stemming from these values, while rich in data, evoke a sense of tumultuous disarray, prompting the necessity for smoothing. Livshin, the cryptic maestro, prescribes a remedy — a 14-period Simple Moving Average (SMA). However, the practitioner of this arcane art reserves the right to manipulate the number of periods, tailoring it to the peculiar temporality under the scrutiny of the chart.
Behold the resultant indicator, a spectral entity oscillating within the paradoxical bounds of -1 to +1. A positive manifestation in this cryptic realm signifies a security concluding above its inaugural state. The value’s magnitude serves as an augury, indicating the profundity of the positive metamorphosis in price. A zenith of +1, a rarefied attainment, would signify a security unfurling its cryptic wings at the nadir and majestically closing at the zenith for each epoch enshrouded within the moving average’s contemplative gaze. The BOP, a beacon in the bewildering expanse of financial analysis, unveils the intricate dance between bullish and bearish forces, inviting the adept to decipher its mystifying revelations.
1. Ascending zero line crossover It indicates the rise of the volume of trades in Uniswap that the power characteristic crosses zero, which gives a signal. This scan is just a starting point. Further refinement and analysis is required.
2. Crossing the descending zero line It shows the decrease in the volume of trades in Uniswap, which is a bearish sign. This scan is just a starting point. Further refinement and analysis is required.
(Fore more information: https://support.stockcharts.com/doku.php?id=scans:indicators#balance_of_power_bop)
V. OBV
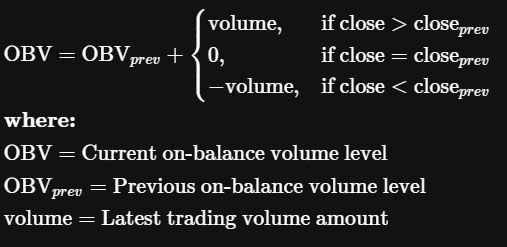
On-Balance Volume (OBV) measures buying and selling pressure in the market. The OBV is calculated by adding the volume of an asset to the OBV when the price of the asset increases and subtracting the volume when the price of the asset decreases.
Formula for On-Balance Volume (OBV)
What Does OBV Tell You?
The On-Balance Volume (OBV) theory centers on differentiating institutional investors (smart money) from retail investors. When mutual funds and pension funds buy an asset retail investors are selling, volume increases even as the price stays steady, eventually driving it upward. The actual numerical value of OBV is insignificant, as it’s cumulative and dependent on the start date. Traders focus on OBV movements over time, with the slope of the line carrying the weight of analysis. Analysts use OBV volume to track institutional investors, identifying divergences between volume and price as indicators of the relationship between smart money and the broader market, revealing opportunities to counter prevailing trends.
In the chart below, by calculating the weekly swap volume, MACD, Bitcoin Closing Price, and the signal line and observing the past history, it can be concluded that since the 11th of 2023, when the MACD line has gone below the signal line, the trade volume has increased. We are in Uniswap, which has coincided with the increase in the price of Bitcoin in the middle of the 10th month of 2023.
Embarking on the Uniswap Liquidity Pool Odyssey Amid Bearish Turbulence
In the intricate realm of navigating Uniswap liquidity pools amidst bearish tumult, practitioners may weave a tapestry of strategies to weather the storm:
-
Ethereal Liquidity Monitoring: Engaging in the spectral act of monitoring liquidity flux unveils the depths of the market, a cryptic endeavor to foresee potential slippages. Real-time data platforms, like mystical oracles, provide the foresight required for making decisions of arcane significance.
-
Harnessing the Stablecoin Elixir: Amidst the tempest of bearish sentiments, stablecoins emerge as the elixir, shielding traders from the capricious dance of price volatility. Conjuring stability in portfolios, traders entwine stablecoins like USDT or DAI in their trading pairs, an alchemical safeguard against potential losses.
-
Venturing into the Esoteric Trading Pair Enigma: Uniswap’s pantheon of trading pairs beckons adventurers to explore the enigma of diversity. Delving into the abyss of less trodden or undervalued tokens, traders unveil cryptic opportunities, navigating the bearish labyrinth with the promise of potential gains.
-
Becoming a Liquidity Oracle: For those endowed with excess assets, the ritual of becoming a liquidity provider unfolds. Consecrating assets to the liquidity pools, practitioners partake in a sacred communion, earning fees and riding the currents of price fluctuations, a dance of risk and reward.
VI. Conclusion
The Uniswap liquidity pools, akin to mystical conduits, play a symphonic role in the tapestry of trading amidst both bullish and bearish echoes. The bearish symphony, with its melancholic notes, presents challenges, yet Uniswap’s automated market-making sorcery and permissionless nature weave a spell of liquidity resilience. Through the adoption of sagacious strategies and vigilant observance of market constellations, traders can navigate the Uniswap liquidity pools adeptly, potentially seizing opportunities hidden in the shadows of bearish sentiments. It is imperative to note that this mystical manuscript imparts no investment counsel; individuals are urged to embark on thorough research and seek the counsel of financial soothsayers before casting their lots in the cryptic sea.